Research Article | | Peer-Reviewed

Seasonal Inter-comparison of Fine Particulate Matter (PM2.5) Over Addis Ababa, Ethiopia

Received: 5 November 2024     Accepted: 15 November 2024     Published: 29 November 2024
Views:       Downloads:
Abstract

The seasonality of meteorology significantly influences the distribution of atmospheric pollution that have harmful effect on human, environment and economy. Similarly, Ethiopia has erratic seasons, this can impact air pollution. Thus, this study focused on intercomparison of PurpleAir PM2.5 measurement at Addis Ababa city. The existing data processed by R software. Accordingly, the finding show that, during the rainy season, PM2.5 levels exhibit a consistent pattern with concentrations peaking in the early night and reaching their lowest at midday. At Black Lion Hospital (BLH), peak concentrations extend to midday due to due to heavy traffic and cross-sectional jams to travel commercial areas. In contrast, during the semi-rainy and dry seasons, PM2.5 levels peak in the early morning and decrease by midday. Hourly variations in PM2.5 concentrations could be influenced by factors such as temperature inversion, wind, relative humidity, and solar intensity, alongside transportation and industrial activities. Analysis reveals that a significant proportion of the seasonal hourly mean trend during the rainy season, vary in between 30 µg/m3 to 50 µg/m3 of the hourly data while 15 µg/m3 to 40 µg/m3 of data in both the semi-rainy and dry seasons also surpass these guidelines. Despite the general reduction in pollution levels due to rain, the rainy season still contributes to elevated PM2.5 concentrations, posing substantial risks to human health, the environment, and development activities. The monthly mean pattern further highlights a peak in PM2.5 concentrations during the rainy season, underscoring the complex dynamics of air quality. This finding emphasizes the need for targeted strategies to manage pollution throughout the year. The finding suggest that, expand air quality monitoring, and reduce traffic emissions, strengthen industrial regulations and increase public awareness. It may relevance for air quality management strategies for local and regional governments.

Published in International Journal of Environmental Monitoring and Analysis (Volume 12, Issue 6)
DOI 10.11648/j.ijema.20241206.11
Page(s) 141-148
Creative Commons

This is an Open Access article, distributed under the terms of the Creative Commons Attribution 4.0 International License (http://creativecommons.org/licenses/by/4.0/), which permits unrestricted use, distribution and reproduction in any medium or format, provided the original work is properly cited.

Copyright

Copyright © The Author(s), 2024. Published by Science Publishing Group

Keywords

Seasonality, Comparison, PurpleAir, PM2.5, Addis Ababa

1. Introduction
Pollution is the introduction of harmful substances into the environment, reducing its quality with high concentrations of harmful solids, liquids, or gases. Extensive studies have explored human interactions with their surroundings, where various activities impact the environment a blend of living organisms (biotic) and the non-living elements (abiotic) like atmosphere and air pollution is a significant problem affecting both climate change and public health through increased sickness and death rates .
In global regions with distinct wet and dry seasons, such as Southeast Asia, monsoon rains during wet seasons can drastically reduce pollution levels by washing pollutants out of the atmosphere, in contrast, dry seasons often experience elevated pollution levels due to reduced rainfall and increased biomass burning
Seasonality significantly influences air pollution levels due to variations in weather patterns, temperature, human activities, and vegetation across different times of the year . During colder months, air pollution increases due to greater fossil fuel usage for heating, emitting more particulate matter, sulfur dioxide, and nitrogen oxides. Reduced solar radiation slows pollutant breakdown. Winter thermal inversions, where warm air traps cooler air near the ground, further worsen air quality by preventing pollutants from dispersing . Higher temperatures in the summer increase the formation of ground-level ozone (O3), a harmful air pollutant. Sunlight and heat catalyze chemical reactions between nitrogen oxides (NOₓ) and volatile organic compounds (VOCs), leading to elevated ozone levels . Warmer weather often means better atmospheric mixing and higher wind speeds, which can disperse pollutants more effectively. However, in some regions, the stagnant air during heat waves can lead to elevated concentrations of pollutants . In transitional seasons like spring and autumn, air pollution levels become more variable due to changing environmental factors. Spring often brings reduced pollution through increased vegetation and air circulation, but pollen spikes and biogenic emissions from plants can still contribute to particulate matter and ozone formation. Autumn sees rising pollution levels as heating starts. So that, these seasonal variations highlight the complexity of air quality management and the need for flexible strategies to address different pollutants . However, the seasonal effects on air pollution can vary significantly depending on geographic region, type of pollutants, and local meteorological conditions. Global trends suggest that winter tends to exacerbate pollution problems, while summer increases ozone levels due to heat and sunlight.
Ethiopia experiences distinct seasonal variations, such as Kiremt (Rainy Season): June to September, Belg (Short Rainy Season): March to May and Bega (Dry Season): October to February that influence its climate, agriculture, and daily life . The country’s seasons are primarily shaped by the movement of the Intertropical Convergence Zone (ITCZ) and are defined by its geographical location within the tropics and highland topography. These seasonality might have an influence the distribution of air pollution by rising and sinking.
Addis Ababa, the capital of Ethiopia, experiences a temperate highland climate with distinct wet and dry seasons. Due to its high altitude (about 2,355 meters or 7,726 feet above sea level), the city enjoys mild temperatures throughout the year. The climate in Addis Ababa is largely influenced by the movement of the Inter-tropical Convergence Zone (ITCZ) and the surrounding mountainous topography . Therefore, this seasonality also plays a significant role in influencing air pollution patterns in the city's atmosphere. In the Bega season, Addis Ababa faces worsened air pollution due to increased dust, thermal inversions trapping pollutants, and biomass burning . Addressing these issues requires improved road surfaces, stricter construction regulations, and cleaner alternatives for heating.
However, there is a limitation in studies that confirm the impact of meteorological seasonality on the seasonal distribution of pollutants. Thus, this study focused on analysis of seasonal inter comparison of PurpleAir fine particle matter (PM2.5) over Addis Ababa. This study is important for providing information about the impacts of seasonality of meteorology on the seasonal distribution of PM2.5. It also aims to identify advisory solutions to address the growing relationship between urban meteorology and air pollution. In addition, it offers recommendations for air pollution control strategies and management activities for local governments, the public, planners, and researchers, in response to the impact of air pollution on health, the environment, and ecology.
2. Data and Methodology
2.1. Study Area
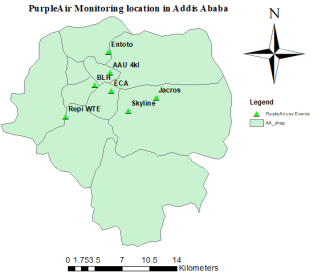
Figure 1. Study area and PurpleAir monitoring locations.
Addis Ababa, the capital city of Ethiopia, is situated in the central highlands of the country at an elevation of approximately 2,355 meters (7,726 feet) above sea level, has a latitude range of 8.833-9.01 N and longitude range of 38.64-38.9 E. This elevation can influence air quality by affecting atmospheric conditions such as temperature and wind patterns. Air pollution in Addis Ababa is primarily driven by emissions from vehicle traffic, industrial activities, and the burning of solid fuels. And also, the city's rapid urbanization and population growth have exacerbated pollution levels, contributing to health concerns among its residents. The sub-tropical climate sees average temperatures ranging from 10°C. Seasons fluctuate from cool (10-15°C) to warm (20-23°C). The wet season lasts from June to mid-September. Atmospheric conditions influence pollutant levels. Figure 1 shows the geographical location of Addis Ababa's city and the location of PurpleAir PM2.5 monitoring device.
2.2. Data
Air quality monitoring in Ethiopia relies on Federal Reference Method (FRM), Federal Equivalent Method (FEM), and low-cost PurpleAir (PA) sensors. FRM and FEM are precise but expensive, while PA sensors, despite lower accuracy, provide useful data on PM2.5, air temperature (0F) and relative humidity (RH). This study analyzed minutely data from seven PA sensors in Addis Ababa, installed by NASA-MAIA, covering January 2022 to December 2023. Challenges like calibration issues and missing data were addressed using the Seasonal and Trend decomposition using Loess (STL) method, which handles seasonal variations and imputes missing values effectively. To enhance PM2.5 measurement accuracy from PA sensors, data were calibrated using a regression model based on co-located PA and BAM data . Applied to the model adjusted PM2.5 concentrations for air temperature (Tair) and relative humidity (RH). Calibration improved 7.10 and R² from 70.2% to 75.6%, using calibration equation 1 developed by the NASA-MAIA project.
PM2.5, calibrated =17.189+0.664*PM2.5row+8*10-3*Tair-0.153*RH(1)
2.3. Data Proses and Analysis
Air quality data processing and analysis require various tools across different stages, including data acquisition, cleaning, analysis, and visualization. This study utilized R statistical software (R 3.6.2; https://www.r-project.org/) for statistical processing and analysis of PM2.5 concentrations.
2.4. Method
There are a lot of techniques to analysis atmospheric pollution, such as air quality index (AQI), air quality guideline (AQG), wind rose, wind direction, and time series analyses. However, this study examined the time series along with seasonal change and daily AQG level. Thus, the study examined seasonal variations in atmospheric PM2.5 along with monitoring location in the city. It analyzed how seasonal changes impact PM2.5 levels distribution. And also The World Health Organization’s Air quality guidelines (AQG) set global targets for governments to improve citizen health by reducing air pollution. Clean air is a fundamental human right, yet global air pollution remains a major threat to health, causing non-communicable diseases like heart attacks and strokes . Therefore, the study follows WHO 2021 guidelines for PM2.5 levels: 15 µg/m3 for 24 hours.
3. Result and Discussion
3.1. Hourly Mean of Rainy, Semi Rainy and Dry Season
Kampala's air quality fluctuates seasonally, with PM10 and PM2.5 levels dropping during the rainy season, though pollutants from cooking and traffic remain steady . Nairobi faces air pollution from particulate matter and NO₂, with the rainy season reducing but not eliminating traffic-related spikes. Tanzania's coastal city experiences air pollution from traffic and industry; rain lowers pollutant levels, but traffic peaks increase CO and NO₂ locally . In Addis Ababa, vehicular emissions and industrial activities cause significant pollution. The rainy season reduces PM2.5 and PM10 levels, but daily traffic peaks lead to temporary rises . The semi-rainy season in Central and East Africa (March-May, October-December) can significantly impact air pollution. Rain generally reduces particulate matter and pollutants, but effectiveness varies with rain consistency and wind. Dust storms and biomass burning remain key pollution sources, especially in rural areas. Urban areas may still experience high pollution due to traffic and industry, while rural areas might see improved air quality offset by agricultural practices and biomass burning . Air pollution in Ethiopia during the semi-rainy seasons (March-May, October-December) is influenced by rainfall, biomass burning, and urban emissions. Rain generally reduces pollutants, but biomass burning and traffic emissions persist, limiting overall improvements . Typically, cities in Ethiopia experience a dry season (usually from October to May) and a wet season (from June to September). Air quality might vary between these seasons due to factors like dust during the dry season and increased pollution from biomass burning during the wet season . World Health Organization (WHO) Air Quality Data). The local factors might be like traffic patterns, industrial activity, and biomass burning can also influence seasonal pollutant levels. Similarly, this research finds that during the rainy season (see Figure 2), hourly mean PM2.5 distribution is consistent across all monitoring locations, with maximum concentrations observed in the early night and minimum concentrations at midday. However, at Black Lion Hospital (BLH), the peak extends to midday due to the area's commercial nature and heavy traffic congestion. In contrast, during the semi-rainy and dry seasons (see Figures 3 and 4), PM2.5 distribution remains consistent, with maximum concentrations in the early morning and minimum concentrations at midday. In addition to activities like transportation and industrial processes, hourly variations during each season are influenced by factors such as temperature inversion, wind, relative humidity, and solar intensity.
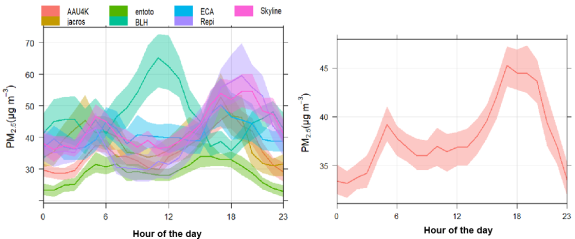
Figure 2. Hourly mean concentrations of PM2.5 rainy season (Jun to September): Individual sites (left) and overall average (right).
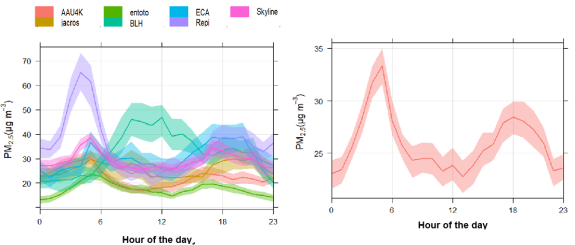
Figure 4. Hourly mean concentrations of PM2.5 during Dry season (October to January): Individual sites (left) and overall average (right).
3.2. Seasonal Hourly Mean Trend
A limited number of short term PM2. 5 data sets in East Africa have shown concentrations nearly 10 times higher than the yearly average WHO guideline values (5 µg/m3), and approximately 4 times higher than the 24-hour average (15 µg/m3) . Similarly, figure 5 show that the seasonal hourly mean trend during the rainy season, vary in between 30 µg/m3 to 50 µg/m3 of the hourly data while 15 µg/m3 to 40 µg/m3 of data in both the semi-rainy and dry seasons also surpass these guidelines. This indicates that the rainy season may contribute to increased pollution. This poses a threat to human health, the environment, and ongoing development activities.
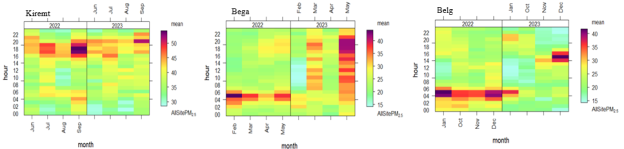
Figure 6.Seasonal trend of P2.5 Rainy season (left), semi-rainy season (middle) and dry season (right)
3.3. Monthly Patterns
The monthly mean pattern of PM2.5 concentrations, as illustrated in Figure 6, exhibits a notable peak during the rainy season (Jun, July, august and September) at individual monitoring sites and the monthly mean of all ministering site have shown similar patterns. This pattern aligns with findings from studies by which reveal similar seasonal variations in PM2.5 levels. These fluctuations are significantly influenced by temperature inversions and local climatic changes. During the rainy season, temperature inversions can trap pollutants near the surface, preventing their dispersion. This leads to an accumulation of particulate matter, such as PM2.5, in the lower atmosphere. Additionally, local climatic factors, including changes in wind patterns and atmospheric stability during the rainy season, can further exacerbate the concentration of these fine particles. These meteorological conditions create an environment conducive to higher PM2.5 levels, despite the common assumption that rain would naturally cleanse the atmosphere.
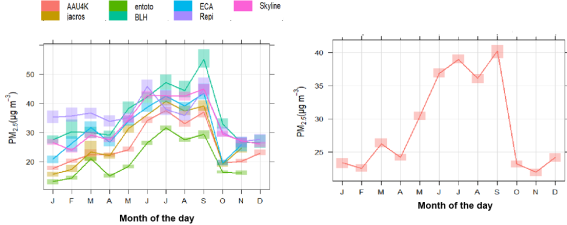
Figure 6. Monthly mean variation of PM2.5: Individual monitoring (left) and the average across all monitoring (right).
4. Conclusion and Recommendation
4.1. Conclusion
This research reveals distinct patterns in the hourly mean distribution of PM2.5 across different seasons: Rainy Season: PM2.5 levels show a consistent distribution across all monitoring locations, with concentrations peaking in the early night and reaching their lowest point at midday. Notably, at Black Lion Hospital (BLH), the peak concentration extends to midday due to the area's heavy traffic and commercial activities. Semi-Rainy and Dry Seasons: PM2.5 levels follow a similar distribution pattern as in the rainy season, with concentrations peaking in the early morning and reaching minimum levels at midday. Across all seasons, hourly variations in PM2.5 concentrations are influenced by factors such as temperature inversion, wind, relative humidity, and solar intensity, in addition to transportation and industrial activities.
The monthly mean pattern of PM2.5 concentrations reveals a peak during the rainy season. This finding underscores the complexity of air quality dynamics and the need for targeted strategies to manage pollution throughout the year, particularly during the rainy season.
Significant proportion of the seasonal hourly mean trend during the rainy season, vary in between 30 µg/m3 to 50 µg/m3 of the hourly data while 15 µg/m3 to 40 µg/m3 of data in both the semi-rainy and dry seasons also surpass these guidelines. This suggests that although rain season generally helps rise pollution levels, the rainy season still contributes to elevated PM2.5 concentrations that pose substantial risks to human health, the environment, and ongoing development activities.
4.2. Recommendation
The finding suggest that, Expand air quality monitoring networks to capture more detailed data on PM2.5 concentrations across different times of day and seasons. This will help in understanding and managing seasonal variations more effectively. Implement measures to reduce traffic congestion and emissions, particularly in areas like Black Lion Hospital (BLH) where peak PM2.5 concentrations extend to midday due to heavy traffic. Promote public transportation and alternative modes of transport to alleviate traffic-related pollution. Strengthen regulations on industrial emissions to reduce the contribution of industrial activities to PM2.5 concentrations. Encourage the adoption of cleaner technologies and practices. Raise awareness about the health impacts of high PM2.5 levels and advise the public on protective measures, especially during periods of high pollution. Develop and implement strategies specifically targeting PM2.5 reduction during the rainy season, where concentrations still peak despite rainfall. This may include addressing local sources of pollution and improving emission controls. Integrate air quality management into broader environmental and urban planning policies to address the complex dynamics of seasonal pollution and its impacts on health and development.
Abbreviations

BLH

Black Lion Hospital

CO

Carbon Monoxide

FRM

Federal Reference Method

ITCZ

Inter-Tropical Convergent Zone

NASA MAIA

NASA Melty Angular Imagery Aerosol

NOX

Nitrogen Oxide

NO2

Nitrogen Dioxide

O3

Ozone

PA

PurpleAir

PM2.5

Particulate Matter Aerodynamic Dimeter 2.5

PM10

Particulate Matter Aerodynamic Dimeter 10

RH

Relative Humidity

STL

Season Trend Lose

Tair

Air Temperature

WHO

World Health Organization

VOCs

Volatile Organic Compound

µg/m3

Microgram Per Meter Cube

0F

Degree Fahrenheit

Ethical Approval Statement
The author affirm that the study titled “Seasonal Inter-comparison of PM2.5" complies with ethical standards. The review relied solely on publicly available data from peer-reviewed sources, with no direct involvement of human or animal subjects. No conflicts of interest exist, and all funding sources, if applicable, are disclosed.
Declaration
The author, declare that the manuscript titled "Seasonal Inter-comparison of PM2.5" is original, has not been previously published, and is not under consideration elsewhere. There are no conflicts of interest, and all funding sources have been disclosed.
Consent to Participate
Not relevant in the manuscript.
Consent for Publication
The author approve to publish the manuscript.
Competing Interests
The authors declare that there are no competing interests regarding the publication of the manuscript titled "Seasonal Inter-comparison of PM2.5"
Grant Information
This research did not receive any specific grant from funding agencies in the public, commercial, or not-for-profit sectors.
Author Contributions
Tofikk Redi is the sole author. The author read and approved the final manuscript.
Data Availability Statement
Data is available on the hand of author.
Conflicts of Interest
The author declares no conflicts of interest.
References
[1] Manisalidis, I., Stavropoulou, E., Stavropoulos, A., & Bezirtzoglou, E. (2020). Environmental and health impacts of air pollution: A review. Frontiers in Public Health, 8.
[2] Kulkarni, S. H., et al. (2019). The impact of monsoons on air pollution in Southern Asia and its associated human health effects. Atmospheric Chemistry and Physics, 19(6), 4155-4178.
[3] Shah, M. H., & Shaheen, N. (2010). Seasonal behaviours in elemental composition of atmospheric aerosols collected in Islamabad, Pakistan. Atmospheric Research, 95(2), 210-223.
[4] Chandra, B. P., et al. (2020). Wintertime pollution events over northern India: Possible linkages to aerosols and weather patterns. Journal of Geophysical Research: Atmospheres, 125(1), e2019JD031742.
[5] Sicard P, Paoletti E, Agathokleous E, Araminienė V, Proietti C, Coulibaly F, De Marco A. Ozone weekend effect in cities: Deep insights for urban air pollution control. Environ Res. PMID: 32919964; PMCID: PMC7483290.
[6] Kalabokas, P. D., et al. (2015). Seasonal variation of ozone in the boundary layer and free troposphere in the Eastern Mediterranean: A 7-year analysis (2006–2012). Atmospheric Chemistry and Physics, 15(14), 8127-8148.
[7] Peron, A., Graus, M., Striednig, M., Lamprecht, C., Wohlfahrt, G., & Karl, T. (2024). Deciphering anthropogenic and biogenic contributions to selected NMVOC emissions in an urban area. EGUsphere, 2024, 1-33.
[8] Segele, Z. T., & Lamb, P. J. (2005). Characterization and variability of Kiremt rainy season over Ethiopia. Meteorology and Atmospheric Physics, 89(1-4), 153-180.
[9] Korecha, D., & Barnston, A. G. (2007). Predictability of June–September rainfall in Ethiopia. Monthly Weather Review, 135(2), 628-650.
[10] Bekele, F., & Bewket, W. (2013). Climate variability and change in the Rift Valley and Blue Nile Basin, Ethiopia: Local knowledge, impacts and adaptation. African Journal of Environmental Science and Technology, 7(5), 347-355.
[11] National Meteorological Agency of Ethiopia (NMA). (2010). Rainfall and temperature variability in Addis Ababa. NMA Ethiopia Report.
[12] Bewket, W. (2009). Rainfall variability and crop production in Ethiopia: Case study in the Central Rift Valley and Addis Ababa. Ethiopian Journal of Development Research, 31(1).
[13] Conway, D. (2000). The climate and hydrology of Addis Ababa, Ethiopia. Geographical Journal, 166(1), 49-62.
[14] Bulto, T. W., & Werku, B. C. (2022). Air quality and health in Ethiopia. In Air Quality and Health. IntechOpen.
[15] Barkjohn, K. K., Gantt, B., & Clements, A. L. (2021). Development and application of a United States-wide correction for PM2.5 data collected with the PurpleAir sensor. Atmospheric Measurement Techniques, 14(6), 4617–4637.
[16] World Health Oorganization Air quality guidelines, 2021. from
[17] Alaran, A. J., O’Sullivan, N., Tatah, L., Sserunjogi, R., & Okello, G. (2024). Air pollution (PM2.5) and its meteorology predictors in Kampala and Jinja cities, in Uganda. Environmental Science: Atmospheres.
[18] Dasgupta, S., Lall, S. V., & Wheeler, D. (2020). Traffic, air pollution, and distributional impacts in Dar es Salaam: A spatial analysis with new satellite data. World Bank Policy Research Working Paper, (9185).
[19] Fenta, H. M., Zewotir, T. T., Naidoo, S., Naidoo, R. N., & Mwambi, H. (2024). Factors of acute respiratory infection among under-five children across sub-Saharan African countries using machine learning approaches. Scientific Reports, 14(1), 15801.
[20] Salah, M., Moursy, F., Soliman, E., & Gamal, G. (2023). Assessing the potential impacts of climate change on droughts in East Africa using CORDEX-CORE regional climate models' simulations: A focus on Tanzania. Contributions to Geophysics and Geodesy, 53(3), 271-300.
[21] Shiferaw, A. B., Kumie, A., & Tefera, W. (2023). The spatial and temporal variation of fine particulate matter pollution in Ethiopia: Data from the Atmospheric Composition Analysis Group (1998–2019). PLOS ONE, 18(3), e0283457.
[22] Keil, C., Kassa, H., Brown, A., Kumie, A., & Tefera, W. (2010). Inhalation Exposures to Particulate Matter and Carbon Monoxide during Ethiopian Coffee Ceremonies in Addis Ababa: A Pilot Study. Journal of Environmental and Public Health, 2010, 213960.
[23] Singh, A., Gatari, M. J., Kidane, A. W., Alemu, Z. A., Derrick, N., Webster, M. J.,... & Pope, F. D. (2021). Air quality assessment in three East African cities using calibrated low-cost sensors with a focus on road-based hotspots. Environmental Research Communications, 3(7), 075007.
[24] Amegah, A. K., Yeboah, K., Owusu, V., Afriyie, L., Kyere-Gyeabour, E., Appiah, D. C. & Mudu, P. (2023). Socio-demographic and neighbourhood factors influencing urban green space use and development at home: A population-based survey in Accra, Ghana. PLOS ONE, 18(6), e0286332.
[25] Thangavel, P., Park, D. and Lee, Y.-C., 2022. Recent insights into particulate matter (PM2. 5)-mediated toxicity in humans: an overview. International journal of environmental research and public health, 19(12): 7511.0.
[26] Etyemezian, V., Tesfaye, M., Yimer, A., Chow, J. C., Mesfin, D., Nega, T., Nikolich, G., Watson, J. G., & Wondmagegn, M. (2005). Results from a pilot-scale air quality study in Addis Ababa, Ethiopia. Atmospheric Environment, 39(40), 7849–7860.
[27] Bulto, T. W. (2020). Impact of Open Burning Refuse on Air Quality: In the Case of “Hidar Sitaten” at Addis Ababa, Ethiopia. Environmental Health Insights, 14, 1178630220943204.
Cite This Article
  • APA Style

    Redi, T. (2024). Seasonal Inter-comparison of Fine Particulate Matter (PM2.5) Over Addis Ababa, Ethiopia. International Journal of Environmental Monitoring and Analysis, 12(6), 141-148. https://doi.org/10.11648/j.ijema.20241206.11

    Copy | Download

    ACS Style

    Redi, T. Seasonal Inter-comparison of Fine Particulate Matter (PM2.5) Over Addis Ababa, Ethiopia. Int. J. Environ. Monit. Anal. 2024, 12(6), 141-148. doi: 10.11648/j.ijema.20241206.11

    Copy | Download

    AMA Style

    Redi T. Seasonal Inter-comparison of Fine Particulate Matter (PM2.5) Over Addis Ababa, Ethiopia. Int J Environ Monit Anal. 2024;12(6):141-148. doi: 10.11648/j.ijema.20241206.11

    Copy | Download

  • @article{10.11648/j.ijema.20241206.11,
      author = {Tofikk Redi},
      title = {Seasonal Inter-comparison of Fine Particulate Matter (PM2.5) Over Addis Ababa, Ethiopia
    },
      journal = {International Journal of Environmental Monitoring and Analysis},
      volume = {12},
      number = {6},
      pages = {141-148},
      doi = {10.11648/j.ijema.20241206.11},
      url = {https://doi.org/10.11648/j.ijema.20241206.11},
      eprint = {https://article.sciencepublishinggroup.com/pdf/10.11648.j.ijema.20241206.11},
      abstract = {The seasonality of meteorology significantly influences the distribution of atmospheric pollution that have harmful effect on human, environment and economy. Similarly, Ethiopia has erratic seasons, this can impact air pollution. Thus, this study focused on intercomparison of PurpleAir PM2.5 measurement at Addis Ababa city. The existing data processed by R software. Accordingly, the finding show that, during the rainy season, PM2.5 levels exhibit a consistent pattern with concentrations peaking in the early night and reaching their lowest at midday. At Black Lion Hospital (BLH), peak concentrations extend to midday due to due to heavy traffic and cross-sectional jams to travel commercial areas. In contrast, during the semi-rainy and dry seasons, PM2.5 levels peak in the early morning and decrease by midday. Hourly variations in PM2.5 concentrations could be influenced by factors such as temperature inversion, wind, relative humidity, and solar intensity, alongside transportation and industrial activities. Analysis reveals that a significant proportion of the seasonal hourly mean trend during the rainy season, vary in between 30 µg/m3 to 50 µg/m3 of the hourly data while 15 µg/m3 to 40 µg/m3 of data in both the semi-rainy and dry seasons also surpass these guidelines. Despite the general reduction in pollution levels due to rain, the rainy season still contributes to elevated PM2.5 concentrations, posing substantial risks to human health, the environment, and development activities. The monthly mean pattern further highlights a peak in PM2.5 concentrations during the rainy season, underscoring the complex dynamics of air quality. This finding emphasizes the need for targeted strategies to manage pollution throughout the year. The finding suggest that, expand air quality monitoring, and reduce traffic emissions, strengthen industrial regulations and increase public awareness. It may relevance for air quality management strategies for local and regional governments.
    },
     year = {2024}
    }
    

    Copy | Download

  • TY  - JOUR
    T1  - Seasonal Inter-comparison of Fine Particulate Matter (PM2.5) Over Addis Ababa, Ethiopia
    
    AU  - Tofikk Redi
    Y1  - 2024/11/29
    PY  - 2024
    N1  - https://doi.org/10.11648/j.ijema.20241206.11
    DO  - 10.11648/j.ijema.20241206.11
    T2  - International Journal of Environmental Monitoring and Analysis
    JF  - International Journal of Environmental Monitoring and Analysis
    JO  - International Journal of Environmental Monitoring and Analysis
    SP  - 141
    EP  - 148
    PB  - Science Publishing Group
    SN  - 2328-7667
    UR  - https://doi.org/10.11648/j.ijema.20241206.11
    AB  - The seasonality of meteorology significantly influences the distribution of atmospheric pollution that have harmful effect on human, environment and economy. Similarly, Ethiopia has erratic seasons, this can impact air pollution. Thus, this study focused on intercomparison of PurpleAir PM2.5 measurement at Addis Ababa city. The existing data processed by R software. Accordingly, the finding show that, during the rainy season, PM2.5 levels exhibit a consistent pattern with concentrations peaking in the early night and reaching their lowest at midday. At Black Lion Hospital (BLH), peak concentrations extend to midday due to due to heavy traffic and cross-sectional jams to travel commercial areas. In contrast, during the semi-rainy and dry seasons, PM2.5 levels peak in the early morning and decrease by midday. Hourly variations in PM2.5 concentrations could be influenced by factors such as temperature inversion, wind, relative humidity, and solar intensity, alongside transportation and industrial activities. Analysis reveals that a significant proportion of the seasonal hourly mean trend during the rainy season, vary in between 30 µg/m3 to 50 µg/m3 of the hourly data while 15 µg/m3 to 40 µg/m3 of data in both the semi-rainy and dry seasons also surpass these guidelines. Despite the general reduction in pollution levels due to rain, the rainy season still contributes to elevated PM2.5 concentrations, posing substantial risks to human health, the environment, and development activities. The monthly mean pattern further highlights a peak in PM2.5 concentrations during the rainy season, underscoring the complex dynamics of air quality. This finding emphasizes the need for targeted strategies to manage pollution throughout the year. The finding suggest that, expand air quality monitoring, and reduce traffic emissions, strengthen industrial regulations and increase public awareness. It may relevance for air quality management strategies for local and regional governments.
    
    VL  - 12
    IS  - 6
    ER  - 

    Copy | Download

Author Information