Research Article | | Peer-Reviewed

Community Adaptation to Impacts of Big Dams and Water Harvesting at the Red Sea State (Arba’at and Sinkat Areas)

Received: 9 May 2025     Accepted: 29 May 2025     Published: 14 July 2025
Views:       Downloads:
Abstract

Two locations within Port Sudan state, eastern Sudan, were selected, these were: Arbaat and Sinkat as to represent two different geographical sites and communities, a semi-structured questionnaire was designed for the purpose of the study. Sampling of respondents was done according to a certain formula utilizing numbers of villages and households at each village. SPSS (version 16) and Chi-square were used for data analysis. The results showed that the area is characterized by high temperature (~42°C) and fluctuating rain-fall (150 - 0mm), satellite images showed that for both areas vegetation cover reduced during 10 years and was more evident in Sinkat than Araba’at. Perception of natural resources was acknowledged. Rate of vegetation regeneration within the normal year was rated as fast at both areas. Wild life availability was perceived as increasing. Soil deterioration was related to wind by most participants but less due to water with significant associations (P=0.00) between the respondents’ opinion at both areas. Most farmers at both areas were small scale with 5 feddans ownership but higher in Sinkat (88%) than Ara’at (68%). Significant (P = 0.00) association were obtained farmers’ tenure and the two areas. Most felt the importance of the water harvesting programs, the association in perceptions between the two sites was significant (P = 0.000). Most of the problems came from water pollution from different sources at both areas (90%) Other problems were due to hafir and dam siltation as expressed by most of the respondents at both areas (95%), the associations of the respondents’ opinion between the two areas were significant (P= 0.00). There were also bore holes management problems at both sites as expressed by respondents at Arba’at (79%) and Sinkat (80%). Most (~90%) of the respondents thought that over exploitation of water resources was one of the main problem that existed at both areas. Significant associations in the respondents’ opinion could be detected for dam and hafir siltation (P=.861), bore holes and water over exploitation (P=0.516). Adaptation to natural resources deterioration was through diversification of income as water and charcoal selling. Coping with food insecurity during the dry season was done through reduction in number of meals, sources of proteins and carbohydrates. Malnutrition rate was the highest in children followed by women and elderly, the same results were obtained for the rate of death and diseases with strong (P = 0.000) association in participants’ perception between the two sites.

Published in International Journal of Environmental Monitoring and Analysis (Volume 13, Issue 4)
DOI 10.11648/j.ijema.20251304.13
Page(s) 144-162
Creative Commons

This is an Open Access article, distributed under the terms of the Creative Commons Attribution 4.0 International License (http://creativecommons.org/licenses/by/4.0/), which permits unrestricted use, distribution and reproduction in any medium or format, provided the original work is properly cited.

Copyright

Copyright © The Author(s), 2025. Published by Science Publishing Group

Keywords

Impacts’ Dams Construction, Water Harvesting, Community Perception

1. Introduction
The world is facing multiple challenges in the 21st century and those important challenges for humanity are poverty, food security, scarcity of water and, most importantly, new and complex challenges emerging due to global warming and climate change . Sudan is particularly concerned with impacts of climate change. The majority of its land is quite sensitive to changes in temperature and precipitation and its fragile systems are quite vulnerable. Therefore food security is mainly determined by rainfall and consequently more than 70% of Sudan population is directly dependent on climate sensitive resources for their livelihood The Red Sea Region of Sudan suffers from acute water shortage due to geologic, climatic as well as to topographic factors, where the water supply is very limited and affected by the climatic degradation. Most of the precipitation in the region is lost as surface runoff due to the high elevation of the area relative to the surroundings and the high rates of evaporation.
Across Sudan, UNEP noted a general trend of intensification of traditional rain-fed agriculture and associated land degradation. Many rural poor people rely on a variety of sources of income and subsistence activities that are based on ecosystems and are thus most directly vulnerable to the loss of ecosystem services. These sources of income, often generated by women and children, include small-scale farming and livestock rearing, fishing, hunting, and collecting firewood and other ecosystem products that may be sold for cash or used directly by households.
2. Materials and Methods
The methods for the purpose of this study utilized both secondary and primary data. Two areas were selected on the basis of their diversities in certain aspects as: water catchment areas and capacity, demography, main socio-economic activities. The secondary data utilized meteorological data, geographic information systems (GIS) for selected areas of study. Primary data utilized a semi-open questionnaire targeting the local communities.
2.1. Community Sampling
Villages were randomly selected from each study area according. 100 households were randomly selected from a total 82150 persons at Sinkat, and 100 from a total of 82883 at Arba’at. Households’ selection. The sample was selected for each village according to population size by the following equation:
N=XY£X
Where: N = sample size in the settlement. X = the number of households in the settlement. Y = the sample size selected. X £ = total number of households in a community sample (maps 4.1 and 4.2). This study assessed the existing water harvesting techniques, constraints in their adoption, and how they can be improved to enhance livelihood.
2.2. Meteorological Data
Meteorological data was collected from Khartoum meteorological station, data included; rainfall, maximum and minimum temperatures for last 10 years.
2.3. Satellite Images Remote Sensing
Satellite imagery and aerial photographs were used as tools to analyze vegetation changes for two years (1970 - 1983) for the areas under study (Arba’at and Sikat). The data were treated with the computer programs, based on information deduced from remote sensed landsat multispectral (MSS) images. The results were correlated with community perception about deterioration in vegetation cover.
Normalized Differential Vegetation Index (NDVI) is the vegetation index, used for delineation of vegetation cover during these two years. NDVI is calculated from the visible and near-infrared light reflected by vegetation. Healthy vegetation absorbs most of the visible light that hits it, and reflects a large portion of the near-infrared light. Unhealthy or sparse vegetation reflects more visible light and less near-infrared light. The NDVI is the ratio between the difference in the Infrared and red bands and the sum of bands, i.e.
NDVI = (NIR – RED) /(NIR + RED):
Where, RED and NIR stand for the spectral reflectance measurements acquired in the red and near-infrared regions, respectively. This spectral reflectance is themselves ratios of the reflected over the incoming radiation in each spectral band individually; hence they take on values between 0.0 and 1.0. Calculations of NDVI for a given pixel always result in a number that ranges from minus one (-1) to plus one (+1); however, no green leaves give a value close to zero. A zero means no vegetation and close to +1 (0.8 - 0.9) indicates the highest possible density of green leaves (Figures).
2.4. Statistical Analysis
Statistical Package for Social Sciences (SPSS 16) is used for data analysis of percentages, and to compare between the two study areas. Chi squire test was used to compare between areas in term of social environmental and economic aspects.
Chi Square Test
The chi square analysis has been used to test the null hypothesis as whether there is an association between any two variables or not. The Chi Square statistic compares the tallies or counts of categorical responses between two (or more) independent groups. Chi square tests can only be used on actual numbers and not on percentages, proportions, means, etc.
3. Results
3.1. Area of Study
3.1.1. Location
Arbaat locality is about 35 km northwest of Port Sudan town at latitude 19° and 20N and longitude 37° 15E. It occupies an area of 13m2. Administratively, it belongs to the Red Sea state, representing one of the four localities, of the Red Sea State. The area is a catchment for Khor (seasonal stream). Sinkat is situated 800 m above sea level, with the surrounding hills reaching up to 1200 m above sea level.
3.1.2. Climate
Arabaat is characterized by humid semi-arid climate, with temperature (42°C) during summer June –Sep) and rainy warm climate during the winter (October- June) of average temperature 18°C, where the rain fall is 106mm/year during the winter and 70-100mm/year in the catchment area during the summer. Sinkat has a dry, hot desert climate, with average temperatures ranging from minimum 14-20°C in January/February, to more than 40°C in June/July. Precipitation in the area is low, ranging from 0 - 150 mm annually.
3.1.3. Human Population
Arbaat area is part of Beja homeland, inhabited by two tribes: the Atmen and Kamilab. The documentation by Sandars (1945) indicates that the Amarar (Atman) tribe has settled in Khor Arbaat area for quite a long period of time. At present the Atmen sub-tribes dominate the heart of Arbaat, s delta, while the Kamilab are confined to the eastern parts of the delta, near the Red Sea coast. In Sinkat The Hadandawa, constitute the largest Beja group in Eastern Sudan. The population of Sinkat is mainly Hadandawas, who constitute the largest group within the Beja group of tribes in Eastern Sudan.
3.1.4. Activities
The total number of households in Arabaat is about 625, most of them practicing agriculture as the main source of living, although some households raise small animals such as sheep and goats and a few of them camels. Out of the total area of the Arbaat deltaic fan, the arable lands of Arbaat have recently been estimated at 23,215 feddans (9,750 ha). Of these, about 9.285 feddans (3.900 ha) can readily sustain floods irrigation agriculture. Though difficult to estimate, in the absence of any mapping of spate irrigation, but around 2,400 feddans (1000 ha) are under cultivation during the rainy seasons, A further 8000 feddans (3,380 ha) have the potential for being brought into the spate irrigation system, if more water were available. In Sinkat, most of the rural Hadandawas practice camel and goat pastoralism. Cultivation is generally for local consumption, and is limited by the low and unpredictable rainfall.
3.1.5. Water Resources
Falling immediately adjacent to the Red Sea water body, from which water vapour originates, the direct rain water received in Arba’at is too small to support cultivation, except in exceptional cases. Thus, rainfall in the area has rarely been of significant benefit to the agricultural community, though it might support some natural growth for livestock. The unreliability of rainfall substantially raises the value of and dependence on Khor Arba’at by the local community for both drinking and irrigation purposes. Probability of run-off occurrence (Khor water) varies considerably between a minimum of 168-mm3 (90% probability) and a maximum of 1662 mm3 (at 10% probability) with high loss of evaporation .
3.2. Secondary Data
3.2.1. Meteorological Data
Temperatures for last 10 years showed that for both maximum and minimum temperatures, fluctuations were observed through the years showing an increase from 2006 to 2015 with 2010 showing the highest records, this was more clear for minimum (Figure 1) than maximum (Figure 2). Fluctuations were also observed within the months of each year: the ranges were between 44 to 27°C for maximum and 25 to 19°C for minimum temperature. August and September showed the highest maximum (~45°C), while February and January showed the lowest records (~27°C). For the minimum temperature the highest were recorded within the same months as ~29°C and the lowest at ~19°C. Available records indicated that over the last four decades, the general trend has been downwards, with frequent and successive droughts. This was also shown by the last 10 years (Figure 3) where rainfall fluctuated between 30 to 0 mm with a general decline, although there was a sharp peak during the year 2010 followed by sharp decline from 120 to 0 mm during 2011.
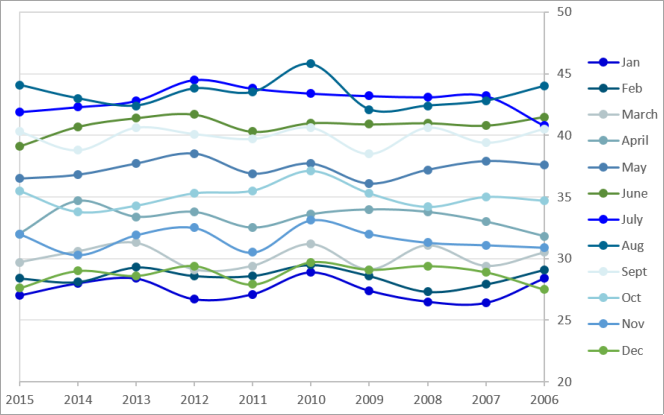
Figure 1. PORT SUDAN MONTHLY MAXIMUM FOR (2006-2015).
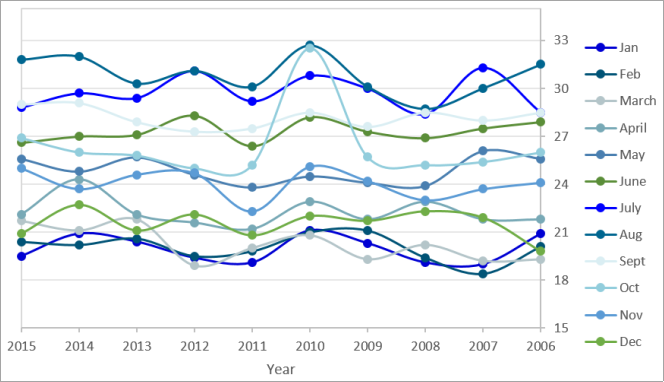
Figure 2. PORT SUDAN MONTHLY MINIMUM FOR (2006-2015).
Source: Sudanese Meteorological data (2016)

Download: Download full-size image

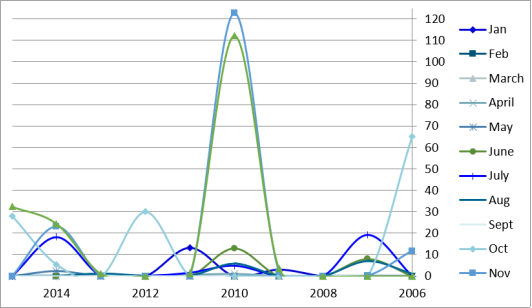
Figure 3. P-SUDAN MONTHLY RAINFALL FOR (2006-2015).
3.2.2. Geographical Information System (GIS) NDVI
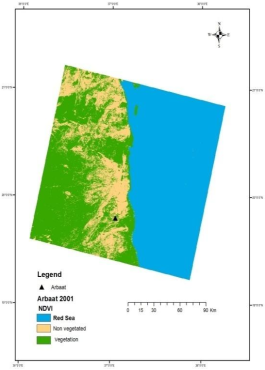
Figure 4. Arba’at NDVI 2010.
The Normalized Differential Vegetation Index (NDVI) could be verified by the natural vegetation index where the maps for the year 2010 as compared to 2013 showed the decrease in vegetation cover. For Arba’at the decrease was calculated as 15% (Fugures 4 and 5), for Sinkat the decrease was 13% (Figures 6 and 7).
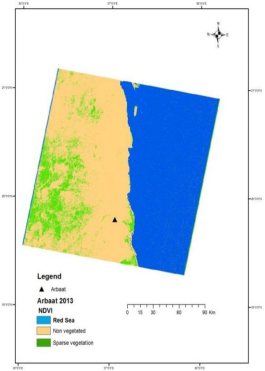
Figure 5. Arba’at NDVI 2013.
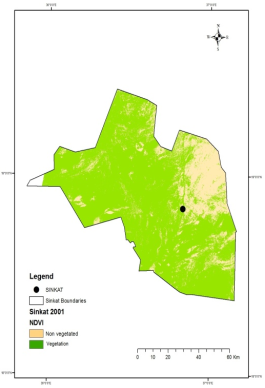
Figure 6. NDVI Sinkat 2010.
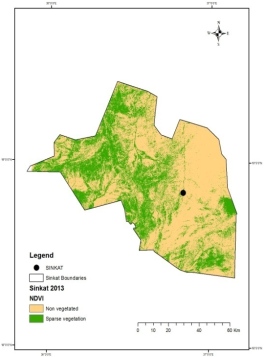
Figure 7. NDNI Sinkat 2013.
3.3. Primary Data
3.3.1. Questionnaire Results
Environmental Aspects
Perception of respondents on natural resources for both sites showed that woodland availability existed, however, 40% in Arba’at and 90% in Sinkat were positive (Table 1). Rate of vegetation regeneration within the normal year was rated as fast by respondents of Arba’at (50%), and Sinkat (70%). No significant association in vegetation rating is obtained as shown by the Chi-square test (P = 0.00). Others rated regeneration as moderate at Arba’at (60%), and Sinkat (10%). The Chi-square test also showed no significant associations for this rating (P = 0.04) (Table 2). As for wild life availability, 80% of the respondents thought that it was increasing at Arba’at, but 50% of Sinkat respondents, thought the same with no significant associations obtained in respondents’ opinion between the two areas (P=0.00) (Table 3). (98%) at Arba’at respondent related soil deterioration to erosion whereas very few (12%) at Sinkat thought the same reason for soil deterioration. This could be related to larger expansion of agricultural activities in Arba’at compared to Sinkat where the main activity is pastoralism. The Chi-square test showed significant associations between respondents’ opinion in both areas (Table 4). In addition type of erosion was due to wind as expressed by (90%) of the respondents at Sinkat but less by Arba’at (60%). This would further strengthen the fact that pastoralists would experience the negative effect at Sinkat than farmers at Arba’at. Water erosion effect was less experienced by respondents at Sinkat (10%) than those at Arba’at (40%) with significant associations (P=0.00) between the respondents’ opinion at the two areas (Table 5).
3.3.2. Land Use
Most farmers at both areas were small scale with 5 feddans ownership but higher in Sinkat (88%) than Ara’at (68%). Lesser percentages of farmers owned between 5-10 feddan being higher in Arbaat (30%) than Sinkat (6%). While very few at both sites had ownership of more than 5 feddans (Tale 6). Significant (P = 0.00) association were obtained farmers’ tenure and the two areas under study which was higher in Arba’at than Sinkat (Tale 7). Nearly most respondents (~90%) in both areas thought that crops were harvested during the rainy season, while small percentages (~10%) thought they were harvested during the dry season associations in opinions between the two areas were significant (P=0.096) (Table 8) as shown by the Chi-square test.
Table 1. Availability of woodlands in the study areas.

Arba’at

Sinkat

df

p. value

Yes

Count

40

90

1

000

% within areas

40.0%

90.0%

No

Count

60

10

% within areas

60.0%

10.0%

Total

Count

100

100

% within areas

100.0%

100.0%

Table 2. Rate of vegetation regeneration in years of normal rainfall in the study area.

Areas

df

p. value

Arba’at

Sinkat

Fast

Count

50

70

1

.004

% within areas

50.0%

70.0%

Moderate

Count

50

30

% within areas

50.0%

30.0%

Total

Count

100

100

% within areas

100.0%

100.0%

Table 3. Conditions of the wildlife in the study.

Areas

df

p. value

Arba’at

Sinkat

Increasing

Count

80

50

1

000

% within areas

80.0%

50.0%

decreasing

Count

20

50

% within areas

20.0%

50.0%

Total

Count

100

100

% within areas

100.0%

100.0%

Table 4. Signs of soil erosion in the study areas.

Arba’at

Sinkat

df

p. value

Yes

Count

98

12

1

00

% within areas

98.0%

12.0%

No

Count

2

88

% within areas

2.0%

88.0%

Total

Count

100

100

% within areas

100.0%

100.0%

Table 5. Dominance of erosion in the study areas.

Areas

df

p. value

Arba’at

Sinkat

wind erosion

Count

60

90

1

000

% within areas

60.0%

90.0%

water erosin

Count

40

10

% within areas

40.0%

10.0%

Total

Count

100

100

% within areas

100.0%

100.0%

Table 6. Size of farmers’ holdings in the study areas.

Arba’at

Sinkat

df

p. value

less than 5 feddan

Count

68

88

2

000

% within areas

68.0%

88.0%

5-10 feddans

Count

30

6

% within areas

30.0%

6.0%

more than 5 feddans

Count

2

6

% within areas

2.0%

6.0%

Total

Count

100

100

% within areas

100.0%

100.0%

Table 7. Crop harvesting in the study areas.

areas

df

p. Value

Arba’at

Sinkat

During normal rains

Count

96

90

2

.096

% within areas

96.0%

90.0%

During drought years

Count

4

10

% within areas

4.0%

10.0%

Total

Count

100

100

% within areas

100.0%

100.0%

Table 8. Pastoralist and farmers associations in the study areas.

areas

df

p. Value

Arba’at

Sinkat

Yes

Count

60

70

1

.181

% within areas

60.0%

70.0%

No

Count

40

30

% within areas

40.0%

30.0%

Total

Count

100

100

% within areas

100.0%

100.0%

3.3.3. Water Issues
Water Sources and Provision
The most water source was water pipe lines for Arba’at (69%) and boreholes for Sinkat (70%). Hand pumps, dams and hafir were the next (10%) for Arba’at. Dams (20%) and hafir (10%) came next for Sinkat (Figure 8). Distance from watering points for animals was less than 1km for 95% of livestock in Arba’at, and from 1-2km for 80% of livestock at Sinkat (Figure 9). Competition over water resources was thought to be high for respondents at Arba’at (80%) and Sinkat (78%). The Chi-square tests had shown strong (P =0.728) association for the respondents’ opinions between the two areas towards competition over water resources (Table 9). Most of the respondents at Sinkat (70%) thought that water was stored and collected by the community, while less percent thought the same at Arba’at (52%). The Chi square for association of water collection and storage was significant (P=0.00, Table 10). Nearly same percentages of respondents at Arba’at and Sinkat (60%) thought that water was provided during dry year (Table 11) while most of them (94%) did not think that the supply of water relief was enough (Table 12). There were significant association for respondents’ opinion between the two areas for either provision of water during the dry year (P= 0.885) or supply of water relief (P=0.516).
Most of the respondents at Arba’at (90%) and less at Sinkat (69%) did not think that there was early warning system (Table 13). However, elder traditional prediction of rainfall was thought to be true by most respondents at Arba’at (90%) and Sinkat (90%) (Table 14). The associations were obtained for the former aspect (P =0.00) but not for the latter (P =0.651).
3.3.4. Water Problems
Most of the respondents at Arba’at (80%) and Sinkat (90%) thought that there were problems exist in their areas (Table 15); however, the chi-square test showed no significant (P=.552) associations of the respondents’ opinions between the two areas were detected. Most of the problems came from water pollution from different sources at both areas (90%) (Table 16). Other problems were due to hafir and dam siltation as expressed by most of the respondents at both areas (95%) (Table 17), the associations of the respondents’ opinion between the two areas were significant (P= 0.00).
There were also bore holes management problems at both sites as expressed by respondents at Arba’at (79%) and Sinkat (80%) (Table 18). Most (~90%) of the respondents thought that over exploitation of water resources was one of the main problem that existed at both areas (Table 19). Significant associations in the respondents’ opinion could be detected for dam and hafir siltation (P=.861), bore holes and water over exploitation (P=0.516).
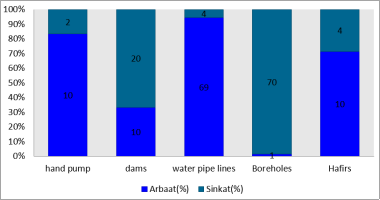
Figure 8. Types of water sources for human and animal.
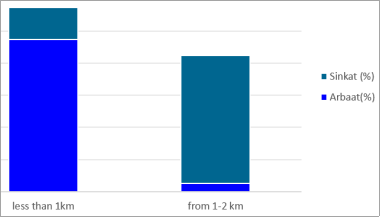
Figure 9. Distance to Animals from watering points.
Table 9. Competition over water sources in the study areas.

Arba’at

Sinkat

df

p. value

Yes

Count

80

78

1

.728

% within areas

80.0%

78.0%

No

Count

20

22

% within areas

20.0%

22.0%

Total

Count

100

100

% within areas

100.0%

100.0%

Table 10. Ways of collection and store of of water in the study areas.

areas

df

p. value

Arba’at

Sinkat

as individual

Count

20

10

2

000

% within areas

20.0%

10.0%

as community

Count

52

20

% within areas

52.0%

20.0%

as government

Count

28

70

% within areas

28.0%

70.0%

Total

Count

100

100

% within areas

100.0%

100.0%

Table 11. Provision of drinking water during drought years.

areas

df

p. value

Arba’at

Sinkat

Yes

Count

40

39

1

.885

% within areas

40.0%

39.0%

No

Count

60

61

% within areas

60.0%

61.0%

Total

Count

100

100

% within areas

100.0%

100.0%

Table 12. Supply of relief water in the study areas.

Arba’at

Sinkat

df

p. value

Yes

Count

6

4

1

.516

% within areas

6.0%

4.0%

No

Count

94

96

% within areas

94.0%

96.0%

Total

Count

100

100

% within areas

100.0%

100.0%

Table 13. The early warning system about coming rains in the study areas.

areas

df

p. value

Arba’at

Sinkat

Yes

Count

10

31

1

000

% within areas

10.0%

31.0%

No

Count

90

69

% within areas

90.0%

69.0%

Total

Count

100

100

% within areas

100.0%

100.0%

Table 14. Elder’s traditional prediction of rains in the study areas.

areas

df

p. value

Arba’at

Sinkat

the elders prediction and traditional ways of prediction rains in the study areas

yes

Count

90

1

.651

% within areas

90.0%

1

no

Count

10

12

% within areas

10.0%

12.0%

Total

Count

100

100

% within areas

100.0%

100.0%

Table 15. Water as a problem in the study areas.

areas

df

p. value

Arba’at

Sinkat

Yes

Count

80

90

1

.048

% within areas

80.0%

90.0%

No

Count

20

10

% within areas

20.0%

10.0%

Total

Count

100

100

% within areas

100.0%

100.0%

Table 16. Pollution of water in the study areas.

Arba’at

Sinkat

df

p. Value

Yes

Count

95

93

1

.552

% within areas

95.0%

93.0%

No

Count

5

7

% within areas

5.0%

7.0%

Total

Count

100

100

% within areas

100.0%

100.0%

Table 17. Dam and hafir siltation at both study areas.

areas

df

p. Value

Arba’at

Sinkat

Yes

Count

96

5

1

000

% within areas

96.0%

5.0%

No

Count

4

95

% within areas

4.0%

95.0%

Count

100

100

% within areas

100.0%

100.0%

Table 18. Bore holes management problems in the study areas.

areas

df

p. value

Arba’at

Sinkat

Yes

Count

79

80

1

.861

% within areas

79.0%

80.0%

No

Count

21

20

% within areas

21.0%

20.0%

Count

100

100

% within areas

100.0%

100.0%

Table 19. Over exploitation of water resources in the study area.

Arba’at

Sinkat

df

p. value

Yes

Count

96

94

1

.516

% within areas

96.0%

94.0%

No

Count

4

6

% within areas

4.0%

6.0%

Count

100

100

% within areas

100.0%

100.0%

3.3.5. Socioeconomic Aspects
Adaptation Activities
Farming activities were the highest at both sites. Pastoralist husbandry practices were higher at Sinkat than at Arba’at. Adaptation activities due natural resources deterioration were: (e.g. agro pastoralism, fisheries, water selling…etc.) (Figure 10). Water selling was higher in Sinkat (98%) than Arba’at (70%); the associations in respondents opinions were significant (P =0.00) (Table 20). Charcoal activities at both sites included burning, marketing and transportation. Many of the respondents at Sinkat (70%) thought charcoal burning was done in the area but many at Arba’at (70%) thought the opposite (Tale 21). Associations in opinions between the two areas were significant (P =0.00). Selling of charcoal at town was most at Arba’at (60%) as expressed by the respondents, however, most respondents at Sinkat (70%) thought charcoal was sold to the local market, while very few thought as near market. Significant (P =0.00) associations in the opinion of the respondents were obtained between the two areas (Table 22). Charcoal transportation was carried mostly by lorry at Arba’at and Sinkat (50%), but to less extent by donkeys and others. Significant (P= 0.398) associations in the opinion of the respondents were obtained between the two areas (Table 23). Selling of charcoal was one of the means of community to diversify their income to meet their urgent demand of buying food.
3.3.6. Malnutrition and Diseases
Most of respondents at Sinkat (74%) and Arba’at (60%) thought that during the rainy season starch constituted their main diet, while lesser percent at both Arba’at (26%) and Sinkat (16%) expressed that both starch and protein constituted their main diet. While, very few thought that they consume a complete diet during the rainy season (Table 24). Two meals were consumed during the normal season with good rainy seasons as expressed by respondents at Arba’at (70%) and Sinkat (60%), whereas one meal was thought to be consumed by respondents at Arba’at (20%) and Sinkat (30%) (Table 25). For both food composition and number of meals, no significant (P = 0.25) associations were obtained in respondents’ opinions between the two areas.
Rate of malnutrition at 11-30%, 31-50%, 51-70% and more than 71% increased from 6 to 23 and 65% respectively for Arba’at. For Sinkat the increases were 0 to 12 and 71% respectively (Table 26). Infant mortality rate at less than 10% or more than 71% decreased from 99 to 1% for Arba’at and from 73 to 27% for Sinkat (Figure 11). Population disease for most vulnerable was 65 and 80% for children at Arba’at and Sinkat respectively. For women it was 24 and 10% at Arba’at and Sinkat respectively. For elderly it was 20 and 0% at Arba’at and Sinkat respectively (Table 27). No Significant (P=0.027) associations were obtained for the three aspects were obtained.
Table 20. Water selling in the study areas.

Arba’at

Sinkat

df

p. value

Yes

Count

70

98

1

0.00

% within areas

70.0%

98.0%

No

Count

30

2

% within areas

30.0%

2.0%

Total

Count

100

100

Table 21. Charcoal burning in the study areas.

areas

df

p. value

Arba’at

Sinkat

Yes

Count

30

70

1

000

% within areas

30.0%

70.0%

No

Count

70

30

% within areas

70.0%

30.0%

Total

Count

100

100

% within areas

100.0%

100.0%

Table 22. Charcoal marketed in the study areas.

areas

df

p. value

Arba’at

Sinkat

Town market

Count

60

20

2

000

% within areas

60.0%

20.0%

Local market

Count

20

70

% within areas

20.0%

70.0%

Near village market

Count

20

10

% within areas

20.0%

10.0%

Total

Count

100

100

% within areas

100.0%

100.0%

Table 23. Means of charcoal transportation in the study areas.

areas

df

p. value

Arba’at

Sinkat

Attributes

Count

10

16

3

0.398

% within areas

10.0%

16.0%

Lorries

Count

60

50

% within areas

60.0%

50.0%

Donkeys

Count

20

20

% within areas

20.0%

20.0%

Others

Count

10

14

% within areas

10.0%

14.0%

Total

Count

100

100

% within areas

100.0%

100.0%

Table 24. The food composition during rainy season in the study areas.

Arba’at

Sinkat

df

p. value

mostly starch

Count

60

74

2

0.10

% within areas

60.0%

74.0%

starch and protein

Count

26

16

% within areas

26.0%

16.0%

complete diet

Count

14

10

% within areas

14.0%

10.0%

Total

Count

100

100

% within areas

100.0%

100.0%

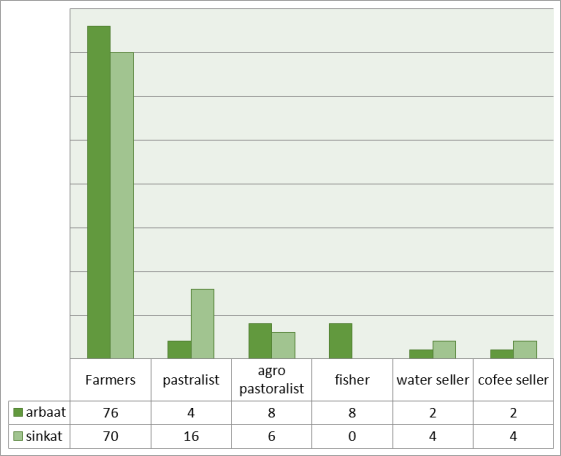
Figure 10. Adaptation activities: farming, pastoralism, agropastoralism, fishing, water and coffee selling.
Table 25. No. of meals per day during rainy and normal years.

Arba’at

Sinkat

df

p. value

one meal

Count

20

30

2

0.25

% within areas

20.0%

30.0%

two meals

Count

70

60

% within areas

70.0%

60.0%

three meals

Count

10

10

% within areas

10.0%

10.0%

Total

Count

100

100

% within areas

100.0%

100.0%

Table 26. Infant mortality rate in the study areas.

Areas

df

p. value

Arba’at

Sinkat

the infant mortality rate in the study areas

less than 10%

Count

99

73

1

0.027

% within areas

99.0%

73.0%

more than 71%

Count

1

27

% within areas

1.0%

27.0%

Total

Count

100

100

% within areas

100.0%

100.0%

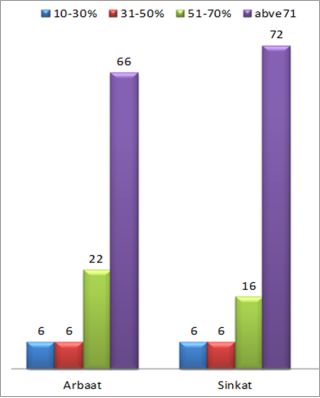
Figure 11. Rate of malnutrition in the study areas.
Table 27. Population affected by diseases.

Arba’at

Sinkat

df

p. value

Children

Count

56

80

3

0.00

% within areas

56.0%

80.0%

Women

Count

24

10

% within areas

24.0%

10.0%

Elders

Count

20

0

% within areas

20.0%

.0%

all groups

Count

0

10

% within areas

.0%

10.0%

Total

Count

100

100

% within areas

100.0%

100.0%

4. Discussion
The land use pattern evolves around animal herding, small–scale traditional cultivation, limited drinking and irrigated ground water holdings and flood basin irrigation. However, traditional dryland farming and animal herding represent the two major land uses in the region. The two activities form the economic basis for survival and adaptation to the prevailing harsh environmental conditions to large group sectors of population. However, UNEP (2005) pointed out that in delta Toker agriculture is more reliable although crop production is practiced under conditions of high risks and uncertainties.
Perception of respondents towards vegetation cover regeneration and wild life population could be associated with their perception to water shortages, soil deterioration and climate change impact which could have led to poor vegetation cover and less wild life population. Cutting of trees and charcoal making were found to be the main activities persisting throughout the year. These had resulted in deforestation and hence reflected on water erosion and soil deterioration and low rate of vegetation regeneration cover. Furthermore removal of vegetation cover had affected wild life population. The negative impact of anthropogenic effects on natural resources and hence climate change was also stated by .
Water resources as obtained from haffir, water yards pumps or pipes suffered from low quality being polluted by silt. High siltation could have occurred due to high evaporation taking place at dam or haffir sites increasing the mud concentration in the water. It was shown that the shortage in water supply was greatly affected the community development and the degradation of cultivated land and animal resources. Similarly it was shown that hand-dug wells have been negatively affected by low rainfall and low river flow, households depending on unreliable water sources have to sustain great costs to purchase water or spend considerable time fetching it .
As most of the respondents were small-scale farmers with less than 5 acres ownership, and they were frequently faced with recurrent droughts, and therefore crop failure, they have to migrate to nearby cities or involved in off-farm activities. Conflicts occurred between farmers and pastoralists as the latter claimed ownership of the farm-lands. Competition also occurred due to migrants coming to the area looking for jobs. They also have to diversify their off-farm activities as adaptation measures in the face of climate change. Therefore they resolve to such activities as water and charcoal selling.
The number of meals was found to be reduced during the dry season as an adaptation to drought conditions and community affordability to buy food from the market. High rates of malnutrition in both areas were obtained among children then women and elderly, the same was detected for mortality rate due to probably to malnutrition and other diseases. Similarly it has been pointed out by the UNICEF that households dependent upon rain-fed crops have been devastated by the lack of rain and have no other substantial sources of food, affecting their ability to purchase food. Many, as a result, were unable to meet their food requirements and children became malnourished .
Most of the respondents at both areas thought that the traditional laws were effective in natural resources management. However, due to the accelerating effect of climate change elder traditional prediction of rainfall could no longer be relied on; thus making the inhabitants of the two areas less resilient to drought shocks.
5. Conclusion and Recommendations
As perceived by most respondents, both areas under study seemed to suffer from soil erosion, loss of vegetation cover and reduction in wild life population. The activity of making charcoal was undertaken throughout the year leading to deforestation and soil deterioration.
People adaptation to drought conditions could be envisaged in reducing their number of meals and eating more fibrous food of low nutritive value, this was also reflected on malnutrition and susceptibility to diseases. Furthermore, some would resolve to migrate other places and some would work in non-agricultural activities. The demand for drinking water was estimated to increase for the years 2007 to 2027 for urban, semi-urban, rural and livestock. Farmers at the delta benefited from this water as they were cultivating some crops fodder and fruits. The availability of water in Sinkat has attracted people from nearby communities such as Gaibet to come and invest in the area putting more pressure and creating conflicts. Conflicts were also raised by pastoralists who visited the area for watering their animals claiming that the cultivated land belonged to them.
It could be recommended that Productivity enhancement measures for increasing the farmers’ incomes through in situ conservation of soil and water, stress tolerant high-yielding cultivars, improved crop, nutrient and pest management options, and equipment in addition to the normal soil and water conservation measures. Water harvesting should be properly controlled for long periods. This would enrich the surface water and ground aquifer allowing vegetation growth leading to better crop yield thus helping the community to enjoy a settled life.
Conflicts of Interest
The authors declare no conflicts of interest.
References
[1] Babiker, M. and Pantuliano, S (2006). Addressing chronic livelihoods vulnerability in Red Sea State, Sudan.
[2] IPCC, Intergovernmental Panel on Climate Change. 2007. Climate Change 2007, Impacts, adaptation and vulnerability. Contribution of Working Group II to the Fourth Assessment Report of IPCC. Cambridge. UK. Cambridge University Press.
[3] IPCC, Intergovernmental Panel on Climate Change 2014. Impacts, Adaptation, and Vulnerability.
[4] Sudan Democracy First Group (SDFG) report, (2017).
[5] UNEP, 2005. Rainwater Harvesting and the Millennium Development Goals.
Cite This Article
  • APA Style

    Mohamed, N. M., Mohamed, M. M. (2025). Community Adaptation to Impacts of Big Dams and Water Harvesting at the Red Sea State (Arba’at and Sinkat Areas). International Journal of Environmental Monitoring and Analysis, 13(4), 144-162. https://doi.org/10.11648/j.ijema.20251304.13

    Copy | Download

    ACS Style

    Mohamed, N. M.; Mohamed, M. M. Community Adaptation to Impacts of Big Dams and Water Harvesting at the Red Sea State (Arba’at and Sinkat Areas). Int. J. Environ. Monit. Anal. 2025, 13(4), 144-162. doi: 10.11648/j.ijema.20251304.13

    Copy | Download

    AMA Style

    Mohamed NM, Mohamed MM. Community Adaptation to Impacts of Big Dams and Water Harvesting at the Red Sea State (Arba’at and Sinkat Areas). Int J Environ Monit Anal. 2025;13(4):144-162. doi: 10.11648/j.ijema.20251304.13

    Copy | Download

  • @article{10.11648/j.ijema.20251304.13,
      author = {Nawara Mohamed Mohamed and Muna Mahjoub Mohamed},
      title = {Community Adaptation to Impacts of Big Dams and Water Harvesting at the Red Sea State (Arba’at and Sinkat Areas)
    },
      journal = {International Journal of Environmental Monitoring and Analysis},
      volume = {13},
      number = {4},
      pages = {144-162},
      doi = {10.11648/j.ijema.20251304.13},
      url = {https://doi.org/10.11648/j.ijema.20251304.13},
      eprint = {https://article.sciencepublishinggroup.com/pdf/10.11648.j.ijema.20251304.13},
      abstract = {Two locations within Port Sudan state, eastern Sudan, were selected, these were: Arbaat and Sinkat as to represent two different geographical sites and communities, a semi-structured questionnaire was designed for the purpose of the study. Sampling of respondents was done according to a certain formula utilizing numbers of villages and households at each village. SPSS (version 16) and Chi-square were used for data analysis. The results showed that the area is characterized by high temperature (~42°C) and fluctuating rain-fall (150 - 0mm), satellite images showed that for both areas vegetation cover reduced during 10 years and was more evident in Sinkat than Araba’at. Perception of natural resources was acknowledged. Rate of vegetation regeneration within the normal year was rated as fast at both areas. Wild life availability was perceived as increasing. Soil deterioration was related to wind by most participants but less due to water with significant associations (P=0.00) between the respondents’ opinion at both areas. Most farmers at both areas were small scale with 5 feddans ownership but higher in Sinkat (88%) than Ara’at (68%). Significant (P = 0.00) association were obtained farmers’ tenure and the two areas. Most felt the importance of the water harvesting programs, the association in perceptions between the two sites was significant (P = 0.000). Most of the problems came from water pollution from different sources at both areas (90%) Other problems were due to hafir and dam siltation as expressed by most of the respondents at both areas (95%), the associations of the respondents’ opinion between the two areas were significant (P= 0.00). There were also bore holes management problems at both sites as expressed by respondents at Arba’at (79%) and Sinkat (80%). Most (~90%) of the respondents thought that over exploitation of water resources was one of the main problem that existed at both areas. Significant associations in the respondents’ opinion could be detected for dam and hafir siltation (P=.861), bore holes and water over exploitation (P=0.516). Adaptation to natural resources deterioration was through diversification of income as water and charcoal selling. Coping with food insecurity during the dry season was done through reduction in number of meals, sources of proteins and carbohydrates. Malnutrition rate was the highest in children followed by women and elderly, the same results were obtained for the rate of death and diseases with strong (P = 0.000) association in participants’ perception between the two sites.},
     year = {2025}
    }
    

    Copy | Download

  • TY  - JOUR
    T1  - Community Adaptation to Impacts of Big Dams and Water Harvesting at the Red Sea State (Arba’at and Sinkat Areas)
    
    AU  - Nawara Mohamed Mohamed
    AU  - Muna Mahjoub Mohamed
    Y1  - 2025/07/14
    PY  - 2025
    N1  - https://doi.org/10.11648/j.ijema.20251304.13
    DO  - 10.11648/j.ijema.20251304.13
    T2  - International Journal of Environmental Monitoring and Analysis
    JF  - International Journal of Environmental Monitoring and Analysis
    JO  - International Journal of Environmental Monitoring and Analysis
    SP  - 144
    EP  - 162
    PB  - Science Publishing Group
    SN  - 2328-7667
    UR  - https://doi.org/10.11648/j.ijema.20251304.13
    AB  - Two locations within Port Sudan state, eastern Sudan, were selected, these were: Arbaat and Sinkat as to represent two different geographical sites and communities, a semi-structured questionnaire was designed for the purpose of the study. Sampling of respondents was done according to a certain formula utilizing numbers of villages and households at each village. SPSS (version 16) and Chi-square were used for data analysis. The results showed that the area is characterized by high temperature (~42°C) and fluctuating rain-fall (150 - 0mm), satellite images showed that for both areas vegetation cover reduced during 10 years and was more evident in Sinkat than Araba’at. Perception of natural resources was acknowledged. Rate of vegetation regeneration within the normal year was rated as fast at both areas. Wild life availability was perceived as increasing. Soil deterioration was related to wind by most participants but less due to water with significant associations (P=0.00) between the respondents’ opinion at both areas. Most farmers at both areas were small scale with 5 feddans ownership but higher in Sinkat (88%) than Ara’at (68%). Significant (P = 0.00) association were obtained farmers’ tenure and the two areas. Most felt the importance of the water harvesting programs, the association in perceptions between the two sites was significant (P = 0.000). Most of the problems came from water pollution from different sources at both areas (90%) Other problems were due to hafir and dam siltation as expressed by most of the respondents at both areas (95%), the associations of the respondents’ opinion between the two areas were significant (P= 0.00). There were also bore holes management problems at both sites as expressed by respondents at Arba’at (79%) and Sinkat (80%). Most (~90%) of the respondents thought that over exploitation of water resources was one of the main problem that existed at both areas. Significant associations in the respondents’ opinion could be detected for dam and hafir siltation (P=.861), bore holes and water over exploitation (P=0.516). Adaptation to natural resources deterioration was through diversification of income as water and charcoal selling. Coping with food insecurity during the dry season was done through reduction in number of meals, sources of proteins and carbohydrates. Malnutrition rate was the highest in children followed by women and elderly, the same results were obtained for the rate of death and diseases with strong (P = 0.000) association in participants’ perception between the two sites.
    VL  - 13
    IS  - 4
    ER  - 

    Copy | Download

Author Information
  • Faculty of Sustainable Rural Development, Department of Rural Extension and Education Development, Ahfad Women University, Omdurman, Sudan

  • Institute of Environmental Studies, Arid Land Coordination Department, University of Khartoum, Khartoum, Sudan

  • Abstract
  • Keywords
  • Document Sections

    1. 1. Introduction
    2. 2. Materials and Methods
    3. 3. Results
    4. 4. Discussion
    5. 5. Conclusion and Recommendations
    Show Full Outline
  • Conflicts of Interest
  • References
  • Cite This Article
  • Author Information